In WINDOWS application development, QHYCCD provides a real-time output through DEBUGVIEW software in order to facilitate developers to call QHYCCD SDK to write their own programs, verify the parameters of incoming and outgoing SDKs, and verify that the calling steps are correct. The method of debugging information. In the QHYCCD SDK development package, there is a directory called SDK with output debug information output. If you use this version of the SDK, and then cooperate with the debugview.exe software, you can see the various debugging information of the SDK output. Can be used to verify that the parameters called and returned are correct. If you compare the debugging information output with EZCAP_QT or SHARPCAP software, you can follow the two software and observe whether the calling process and parameters of the software written by the developer are the same. To work on DEBUG.
Debug basic function introduction
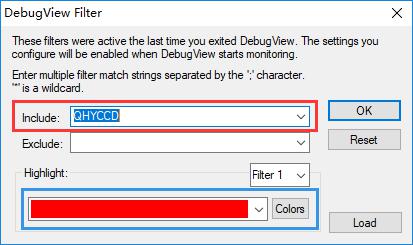
You can search the debugview software online, which is usually available on the Microsoft website. Double-click to open the DebugView software will pop up this Filter window to set the rules for capturing Debug information. Include the keywords of the Debug information. The Debug information containing this keyword will be captured and displayed. To display the debugging information of the QHYCCD SDK, you need to set it. The keyword is QHYCCD; Highlight is used to set the highlight of the Debug information, and the Debug information with the Highlight keyword will be highlighted.
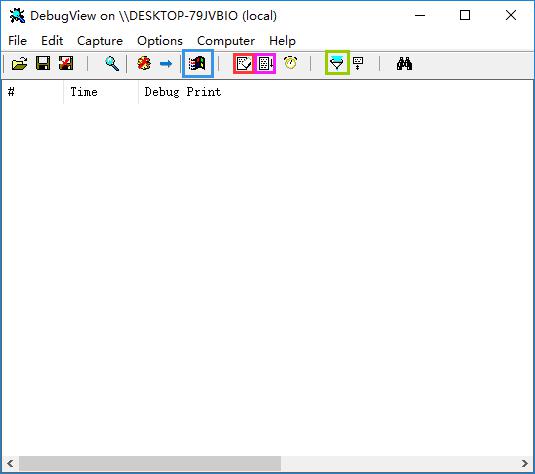
Click OK to enter the main interface of the software:
The button in the blue box is the switch to enable/stop capturing. The button in the red box is used to clear the debugging information. The button in the pink box can be set to scroll the debugging information. The button in the green box can be used to open the button in Figure 1. Set the window. The following section shows the display location of Debug, and the content is displayed in the Debug Printf section.
How to output debugging information of qhyccd.dll
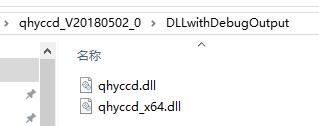
The library in the DLLwithDebugOutput directory of the SDK compression package downloaded from the official website is the switch for opening the Debug information output. Set the Include keyword to QHYCCD according to the above method. At this time, the DebugView software can be used in the corresponding function in the qhyccd.dll library. The Debug information corresponding to the printout is output when the call is made. These Debug information will output the set parameters of the function, and the order of calling the functions can be known according to the Debug information. To output Debug information in continuous mode, you can use SharpCap. To output Debug information in single frame mode, you can use EZCAP_Qt. Use this library to replace the file with the same name in the software installation directory.