

The purpose of this paper is to conduct a series of tests, both on the bench and on real stars, to understand the behavior of the QHY268 Color version to evaluate its potential in terms of science observations for the amateur community. This camera has an APS-C sensor on a bayer RGGB array and it is primarily designed to take color images of the night sky.
Nevertheless, it is equipped with a low noise Sony sensor and its electronics is similar to that of the Mono version we have found excellent to use for doing science observations.
To fully evaluate the potential of this camera we have conducted a series of tests divided in four parts:
- basic performance of the camera to understand primarily the dynamic range and readout noise
- linearity test for each Bayer plane of the camera
- stellar spectroscopy of variable stars
- stellar photometry of variable stars
For the first two goals the camera has been evaluated on a test bench taking and measuring various calibration frames. For the other goals images of real stars are taken and measured.
Similarly to what we have found for the QHY268 Mono, the color version has a very effective cooling system with no problems of condensation and its amp glow electronics is very effective as we have been unable to detect even the slightest amp glow regardless of hyper stretching the dark frames. At the time of this writing, with the latest drivers, the camera has 7 operating modes that offer different dynamic range and readout noise. This is a feature offered only by QHYCCD as to our knowledge there is no other manufacturer on the marketplace that offers cameras with different operating modes. After studying the single modes we have selected mode #5, High Gain 2-CMS that to us appears to be the most promising for scientific applications. For these you want as little noise as possible but also a good dynamic range as, for example, in many star fields you may be compelled to use comparisons stars of very different brightness.
1. Measuring the basic performance of the QHY268 Color
Looking at the curves of mode #5 provided by the manufacturer we can see that the best dynamic range is reached at gain 0 and at gain 56. Applying the methodology indicated by Richard Berry in his software Aip4win it is necessary to take and measure 2 flats, 2 bias and 1 long dark (we have chosen 600 seconds). We have then measured the parameters of the camera at gain 0 and at gain 55-56-57-58-59 and 60 after debayering and converting the frames into monochromatic images (the standard procedure for spectroscopy with color cameras). Temperature has been set at -10C and to avoid pixels with zero value the offset has been set at 15. Offset is basically adding a pedestal to the image and we have found that a value of 15 results in pixels with a minimum value of around 100 ADU across the frame with an average of about 240 ADU which is a good choice for this camera. One impressive thing to notice is that extracting and averaging the two green Bayer planes (see further in this paper to know why this is important for photometry), this camera shows no saturated pixels meaning that we can effectively use sub frames up to 600 seconds of exposure at -10C for science observations.
From the above-mentioned test we have got the following results:
Mode #5 (high gain 2-cms)
| Gain 0 | results | Notes |
| Conversion factor | 1.38 e/ADU | |
| Full well | 90,438 | |
| Readout noise | 4.17 e RMS | |
| Mean dark current | 0.006996e/px/sec at -10C | |
| Dynamic range | 21,687 grey tones | Highest dynamic range |
| Gain 55 | ||
| Conversion factor | 0.64 e/ADU | |
| Full well | 41,942 | |
| Readout noise | 4.02 e RMS | |
| Mean dark current | 0.004607/px/sec at -10C | |
| Dynamic range | 10,433 grey tones | |
| Gain 56 | ||
| Conversion factor | 0.60e/ADU | |
| Full well | 39,321 | |
| Readout noise | 2.05 e RMS | |
| Mean dark current | 0.004254 e/px/sec at -10C | |
| Dynamic range | 19,180 grey tones | |
| Gain 57 | ||
| Conversion factor | 0.59 e/ADU | |
| Full well | 38,665 | |
| Readout noise | 2.02 e RMS | |
| Mean dark current | 0.004852 e/px/sec at -10C | |
| Dynamic range | 19,141 grey tones | |
| Gain 58 | ||
| Conversion factor | 0.58 e/ADU | |
| Full well | 38,010 | |
| Readout noise | 1.91 e RMS | |
| Mean dark current | 0.00465 e/px/sec at -10C | |
| Dynamic range | 19,901 grey tones | Excellent dynamic range with very little readout noise. Requires about 2.4x less exposure compared to Gain 0 |
| Gain 59 | ||
| Conversion factor | 0.57 e/ADU | |
| Full well | 37,355 | |
| Readout noise | 2.00 e RMS | |
| Mean dark current | 0.004318 e/px/sec at -10C | |
| Dynamic range | 18,677 grey tones | |
| Gain 60 | ||
| Conversion factor | 0.54 e/ADU | |
| Full well | 35,388 | |
| Readout noise | 1.84 e RMS | |
| Mean dark current | 0.003644 e/px/sec at -10C | |
| Dynamic range | 19,233 grey tones |
The test results are in line with the numbers provided by the manufacturer. In mode #5 at Gain 0 we have the highest dynamic range of this camera as expected, but we find Gain 58, and in general anything around gain 56-58, a very interesting setting to get a very good dynamic range with a low readout noise, and with the advantage of requiring 2.4x less exposure compared to Gain 0. So the user can choose Gain 0 for bright stars and 58 for fainter ones to avoid very long exposures.
We have then continued to test the behavior of the QHY268 Color in mode #5 at Gain 0 and Gain 58 since we feel that overall these are the best settings for this camera.
2. Measuring the linearity of the QHY268 Color
We have conducted this test, according to Aip4win methodology by Richard Berry, by taking a series of increasing and decreasing flats to measure the deviation in Adu with different exposures. For each exposure time 2 flats and 1 corresponding dark has been taken. At baseline we have set an exposure of 0.5 sec to be slightly above the bias level of the camera and then we have used exposures up to 80 seconds to reach saturation. The test has been conducted in mode #5, at Gain 0 and Gain 58. Offset and temperature still at 15 and -10C respectively. Since this is a color camera we need to extract each RGGB Bayer plane and measured the linearity for each individual channel. Although a lot of useful information can be obtained from the red and blue channel, the green channel is the closest to the Johnson V passband. Averaging the two GG Bayer planes increases the sensitivity and the SNR in this passband and that is probably the best way to do stellar photometry with this camera. Here below we present the results for each individual channel:
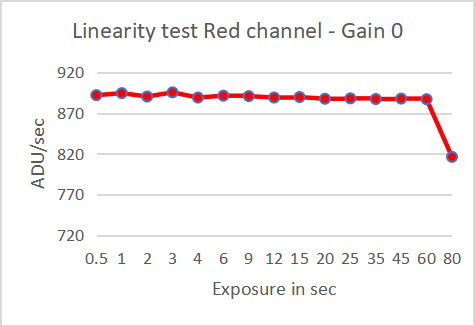
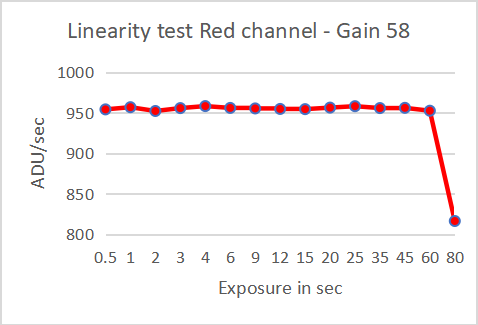
In the red channel the test shows excellent linearity at both Gain 0 and 58 with very little deviation (0.5%) from 450 Adu to about 57,000 Adu
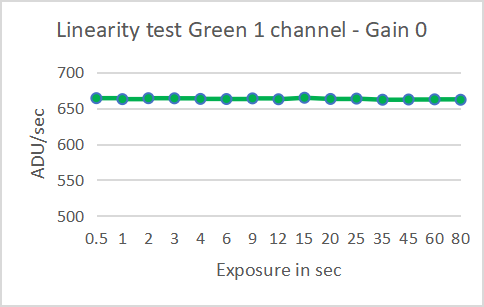
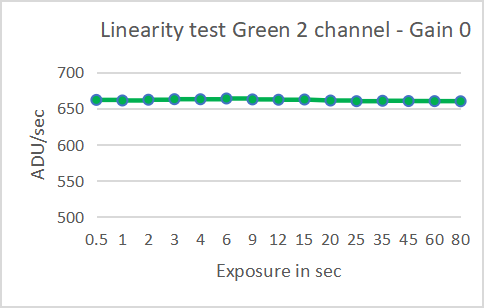
In the two green channels at Gain 0 linearity is still excellent (deviation less than 0.5%) practically from just over the bias level to above 53,000 ADU
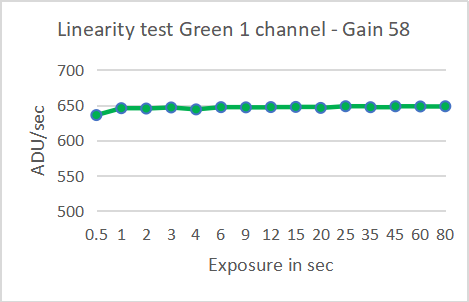
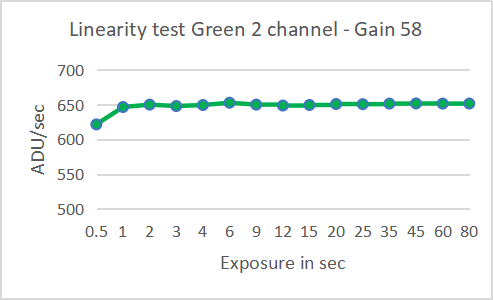
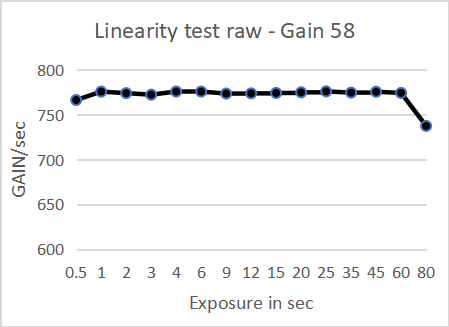
At Gain 58 linearity is still excellent from about 650 ADU to about 53,000 Adu.
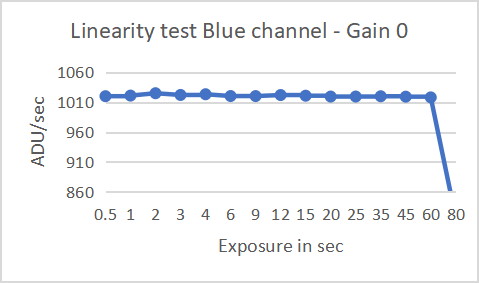

The very good results are confirmed in the blue channel of the QHY268C with excellent linearity measured from 1,000 to 64,000 ADU.
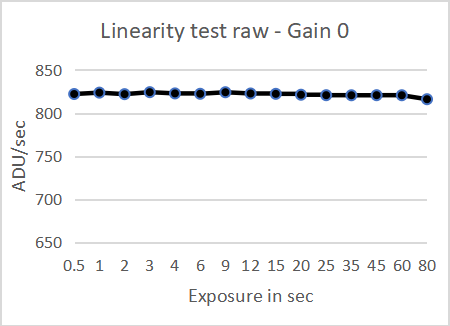
All the above graphs shows that the camera is very linear with an overall deviation of less than 0.5% from just above the bias level to near saturation. To be on the safe side we say from 1,000 to about 55,000 ADU. It means that with the QHY268C we can choose comparison stars much fainter or much brighter of the variable itself without significantly affecting the data.
2.1 Measuring the linearity of the QHY268 Color for spectroscopy and photometry in the green channel
The procedure for doing stellar spectroscopy with a color camera indicates that after calibration we need to Debayer the image to produce a color image and then convert it into a monochromatic image from which we can extract the spectrum profile. For photometry in green channel, that is the closest to the Johnson- Cousins standard system compared to the red and blue channels, we need to average the two green channels after extracting the G1 and G2 Bayer planes. Therefore it is important to evaluate linearity of the QHY268C also at these levels. Here are the results:
Linearity test of the QHY268C after debayering and converting the image into a monochromatic one. Results are excellent with a deviation of around 0.5% from about 800 Adu to about 50,000 Adu. This ensure that we can use this camera for stellar spectroscopy both at Gain 0 and 58 with no bad effect caused by a loss of linearity with the only recommendation to limit the brightest portion of the spectrum to 40,000 – 45,000 Adu.
As regards the average of the two green channels we got the following results:
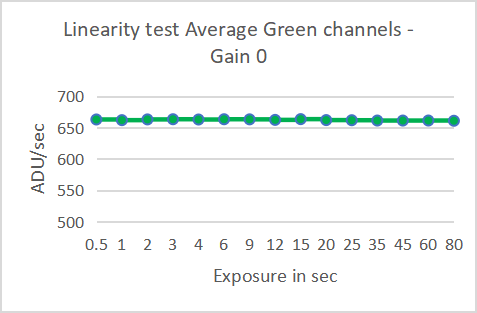

The above graphs demonstrate that the QHY268C is excellent for doing stellar photometry in the green channel. The deviation is less than 0,5% in the 600 – 53,000 Adu interval.
All presented graphs are very sensitive as we have decided to plot the ADU per second instead of plotting the average ADU at each exposure time so that even a minimal deviation can be clearly seen.
We can then conclude that the QHY268C is a very linear camera. It also has very stable electronics as the average value of the dark frames remains practically constant regardless of exposure duration with only small differences in terms of standard deviation.
3. Stellar spectroscopy with the QHY268 Color
Stellar spectroscopy is probably the field where the amateur can deliver the most valuable data to science and today low resolution spectroscopy of variable stars is achievable with a simple grating to be put in front of the camera. With the QHY268C, given it is a color camera, it is mandatory to correct for instrumental response to produce high quality data. We have found that spectroscopy with this camera can be particularly valuable in observing red stars, such as the Miras and Carbon stars, although other kind of spectra can be recorded and analyzed with the proper technique.
The following is the color image taken with the QHY268C and a 6” Newtonian telescope of the spectrum of variable star CS Ursae Majoris a slow irregular red giant that oscillates between mag. 5.07 and 5.19. One interesting thing in using a color camera is that we can immediately tell the color and possibly the spectral class of the star. In this case we can see that the spectrum is longer in the red portion indicating that this is indeed a red star and the presence of alternating bands indicates that the star is a giant.
 Fig.1 Color spectrum of variable star CS Ursae Majoris taken with the QHY268C. We can see that the red portion of the spectrum is longer than the blue/green part indicating that this is a red star. The dark bands that interrupt the spectrum are the hallmark of Titanium Oxide (TiO) molecules that are typical of the atmospheres of red giants.
After converting the image into a monochromatic one, the spectrum profile shows clearly the Tio Molecular bands. It is interesting that after response correction the spectrum of this star taken with the QHY268C is comparable to a spectrum of an M3III class star taken at professional level (plotted in blue). Aside from different resolution (as we are using a grating with prism and not a slit spectrograph), the two spectra appear very similar up to 9,500 Angstrom, really an impressive result for a color camera.
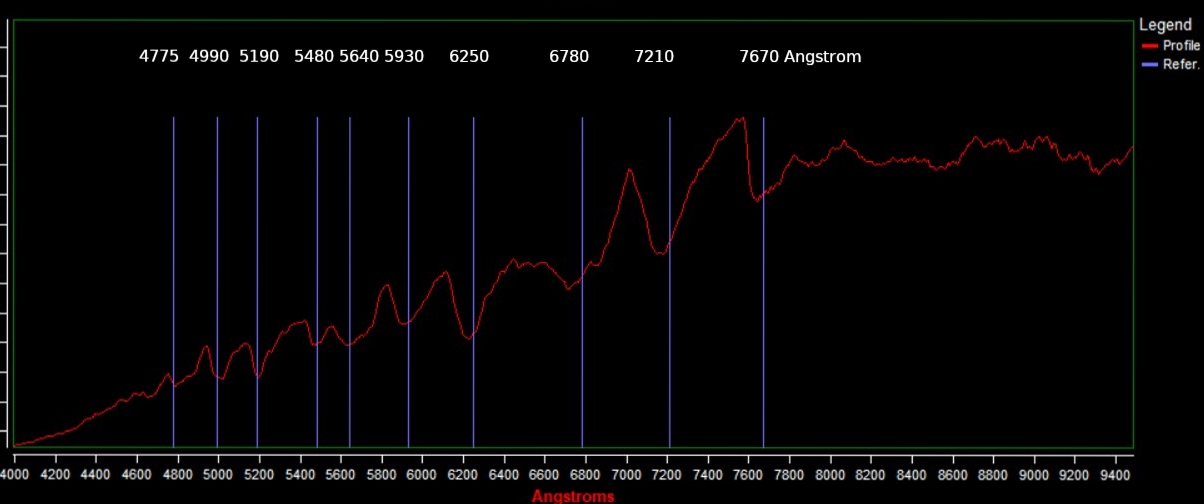 Fig.2 Spectrum profile of variable star CS UMA with the indication of the Titanium Oxide molecular bands detected with the QHY268C and a simple slitless spectrograph. The position in Angstrom of each molecular band is also given
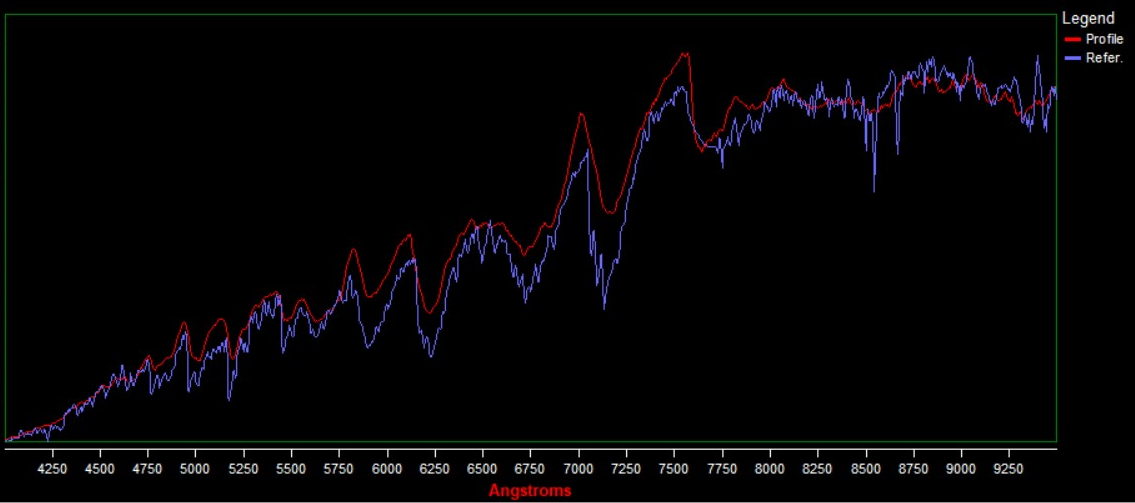 Fig.3 Comparison between the spectrum of CS UMA taken with the QHY268C in red, and the spectrum of an M3III class star taken from a professional Observatory superimposed in blue. Aside from different resolution the 2 spectra appear almost identical up to 9,500 Angstrom, an outstanding result for a color camera
The following one is the color spectrum taken with the QHY268C and an 8” Newtonian telescope of another red giant star, UU Aurigae that varies between mag. 5.1 and mag. 6.6 on a semi-regular period of 235 days. The color image got by the QHY268C indicates that it is a red giant given that the continuum is longer in the red portion. It is interesting to see that this star emits most of the energy in the infrared and that the QHY268C can record light at those wavelengths. As the human eye is insensitive to infrared there is no corresponding color detectable, so the light in the infrared detected by the QHY268C appears in grey (the rightest part of the spectrum of the image).
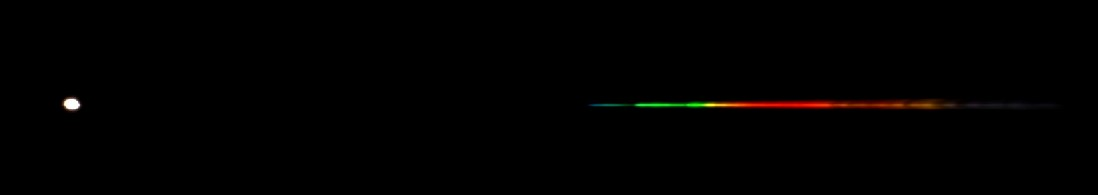 Fig.4 Color spectrum of variable star UU Aurigae taken with the QHY268C. We can see that this star emits most of the energy in red and infrared
Plotting the spectrum profile, after converting the color image into a monochromatic one, we can clearly detect the C2 Swan molecular bands indicating that this is a giant carbon star of spectral class C.
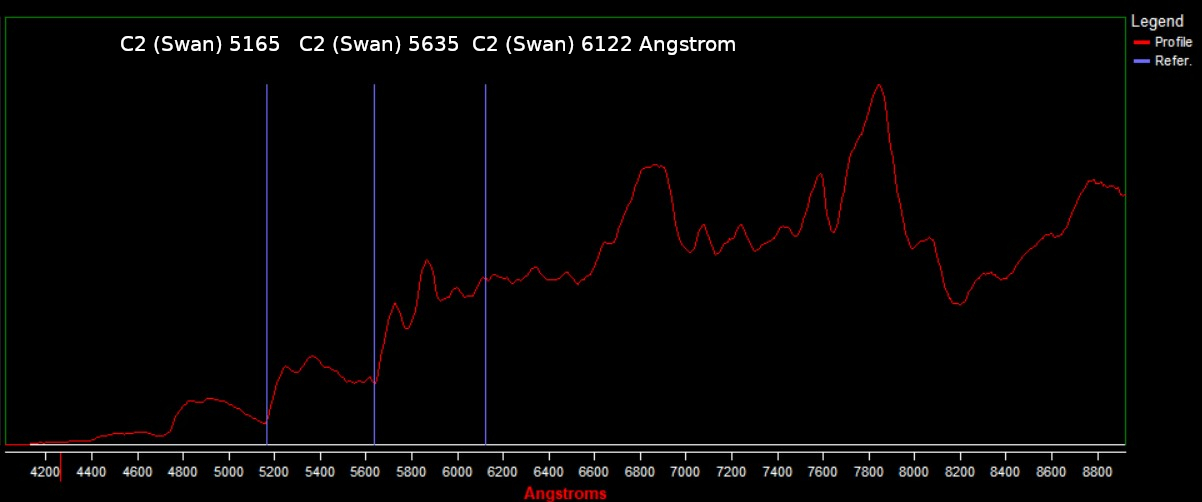 Fig. 5 Spectrum profile of the red carbon star UU Aurigae. Some of the C2 Swan molecular bands that are present in the atmosphere of this stars are highlighted.
We have then moved to a different star, Zeta Tauri, a Be star in the constellation of Taurus that is surrounded by a disk of gas the sometimes get ionized under the radiation coming by the star itself. This time the color spectrum taken with the QHY268C show that the longest portion lays in the blue-green region that is also more intense than the red part. We can also see, faintly, the H-alpha line in emission.
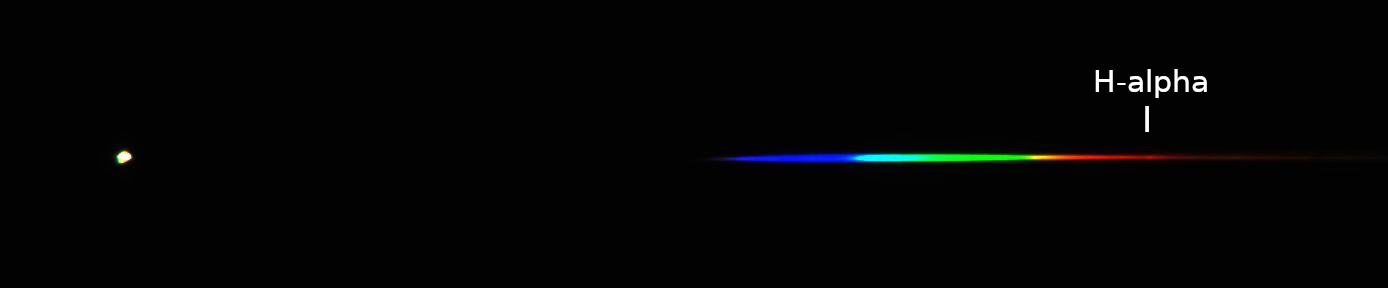 Fig. 6 Color spectrum of the Be star Zeta Tauri taken with the QHY268C. We can see that the blue/green portion is longer and more intense compared to red stars as this is a B class star. We can also detect, though it appears a bit faint, the Hydrogen Balmer H-alpha line in emission indicating that this star is active
Plotting the spectrum profile we can clearly see that this variable star has the H-alpha line in emission.
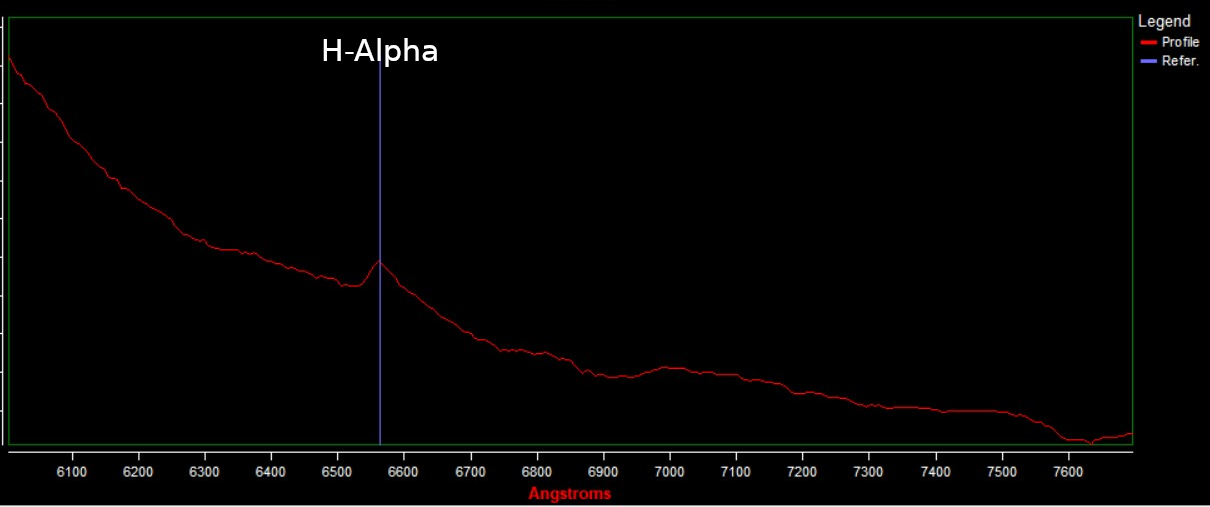 Fig. 7 Spectrum profile of the Be star Zeta Tauri showing clearly the Hydrogen Balmer H-alpha line at 6562.81 Angstrom in emission
We can then conclude that the QHY268C is really an excellent camera to do spectroscopy notwithstanding it is a color camera, and results are valuable at scientific level in this field. All above spectra have been published into the AAVSO AVSpec international spectroscopic database after validation by professional astronomers.
4. Stellar photometry with the QHY268 Color
The first photometric work we have done with this camera is to record the light curve of the eclipsing binary TYC-3807-759-2 in the constellation of Ursae Majoris that oscillates between mag. 9.5 and 9.7. The eclipse has been followed with an 8” Newtonian telescope and the QHY268C. To obtain the light curve we have extracted the two green Bayer planes and averaged them before taking measures.
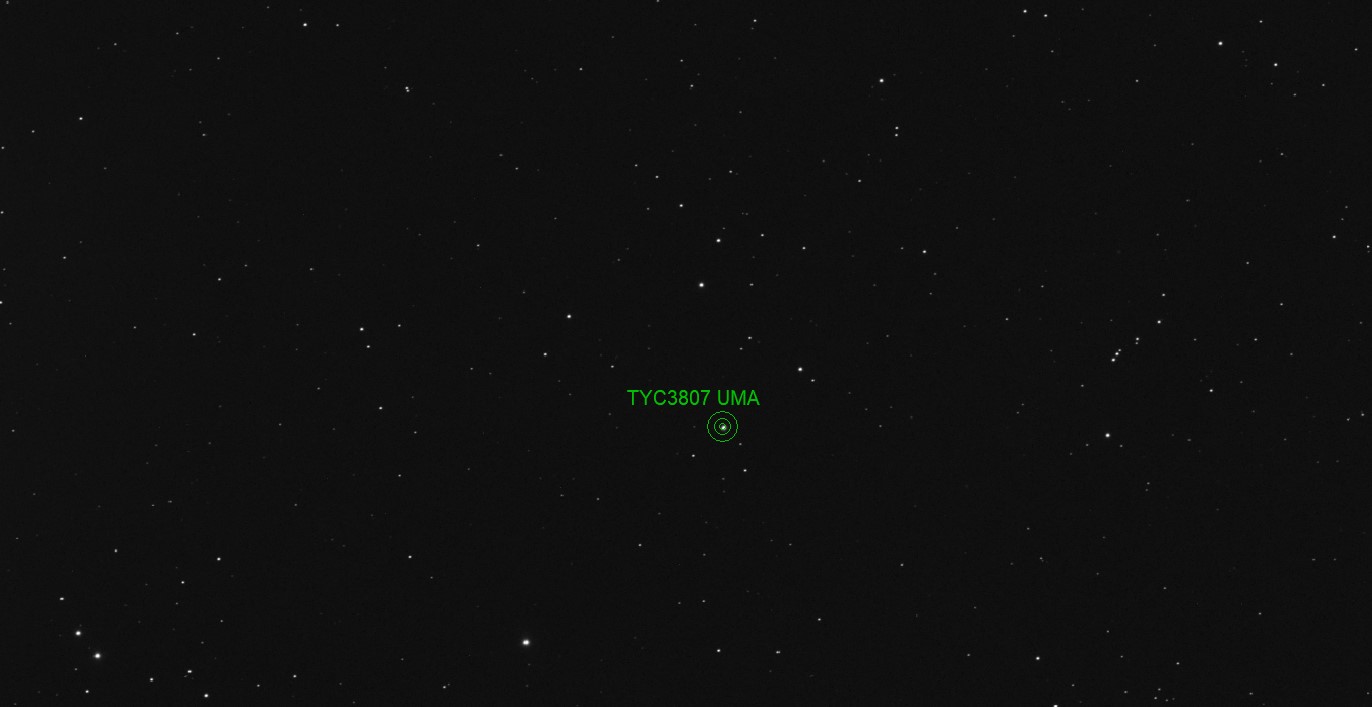 Fig. 8 Stellar field of variable star TYC3807-759-2 UMA taken with an 8” Newtonian telescope and the QHY268C at Gain 58 and offset 15. Average of the two green Bayer planes after extraction
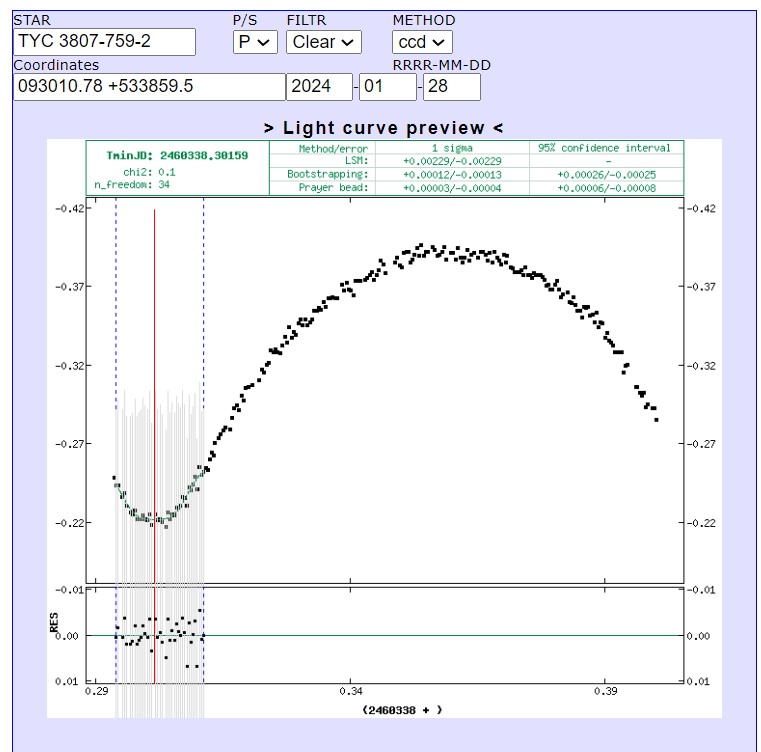 Fig. 9 light curve of ecplising binary TYC3807-759-2 Uma taken with the QHY268C published into the B.R.N.O database of the Czech Astronomical Society. In red is indicated the time of minimum (ToM)
The light curve appears very neat and we can clearly detect the minimum, the rise of the brightness up to the maximum and part of the new descent in brightness of the star towards the minimum. The light curve shows only minimal scatter even if we have chosen individual exposure of only 30 seconds owing to the high quality of the electronics of the camera. It is remarkable that this observation was taken with moon above the horizon.
To stress the camera performance we now move to a much more difficult target. The following is the stellar field of the delta scuti variable TYC2998-900-1, a pulsating star that lies in the constellation of Ursa Major. It varies only slightly, from mag. 11.01 to mag. 11.07 in around 95 minutes as a consequence of radial and non radial internal pulsations that sometimes alter greatly the shape of the light curve.
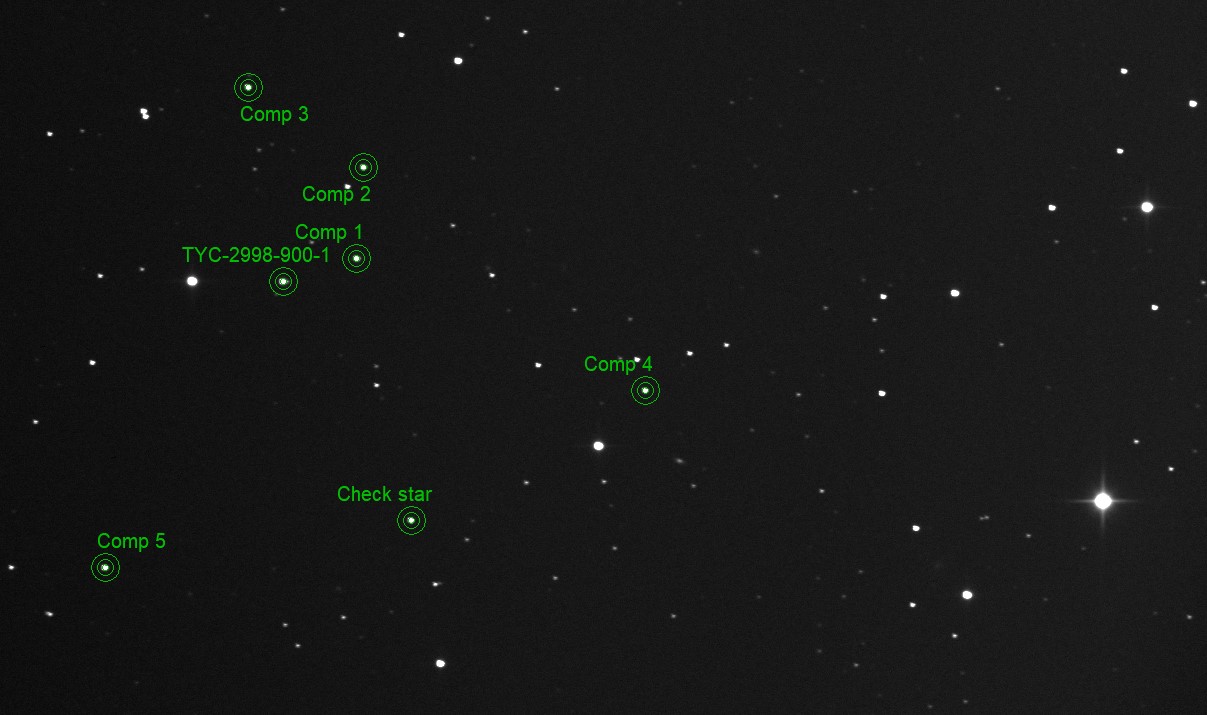 Fig. 10 stellar field of the delta scuti star TYC-2998-900-1 in the constellation of Ursa Major taken through a 6” reflector and the QHY268C at Gain 58 and offset 15. The position of comparisons and check stars are indicated. The images were taken on night with Moon above horizon.
We have then observed and measured the behavior of this star at around minimum, evaluating the part of the light curve with the discent toward the minimum and the subsequent ascent toward maximum. It is remarkable to notice that the light curve appears very neat and clean notwithstanding the depht in brighness was only about 0.03 mag. a value that is comparable to some exoplanet transits. Thus indicated that the QHY268C can be effectively used even in the field of the most demanding photometry.
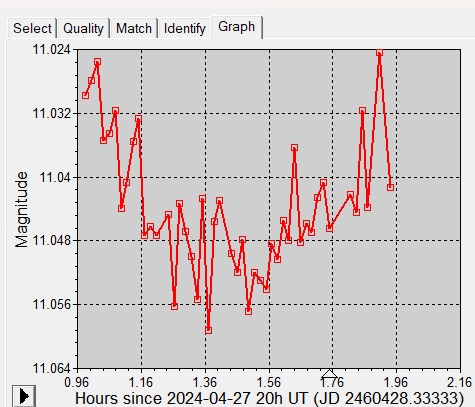 Fig. 11 part of the light curve of the delta scuti star TYC-2998-900-1 showing the descent toward minimum and ascent toward maximum. Regardless moon above horizon and the very small amplitude (about 0.03 mag), the light curve is very clean. Such a small amplitude is comparable to some exoplanet transits indicating that the QHY268C can be effectively used in the field of the most demanding photometry.
Conclusions
The QHY268 Color is an excellent camera for doing any kind of astronomy, from simple color images of the night sky, to demanding stellar photometry, to spectroscopy of variable stars. It can effectively be considered a multi-purpose camera that enables the observer to extend its field of application to science observations, perhaps during the nights with moon above horizon if the primary interest of the user of color cameras may remain the imaging of celestial objects. All scientific observations illustrated in this paper have been published into international databases such as the AAVSO spectroscopy and photometry databases and the B.R.N.O database of the Astronomical Society of Czech Republic.
Please check the following URL for updates: https://alto-observatory.smugmug.com
![[User’s Interview] Kevin Morefield’s Astrophotography Story](https://www.qhyccd.com/wp-content/uploads/20220907400-scaled.jpeg)
![[User’s Interview] Abdullah Alharbi’s Astrophotography Story](https://www.qhyccd.com/wp-content/uploads/20230516907.jpg)