
Abstract
The purpose of this paper is to conduct a series of tests, both on the bench and on real stars, to understand the behaviour of the new QHY268 Mono in the field of science observations for the amateur community. The availability of high end cameras, such as the new CMOS cameras, is now opening an entire new field of observations for the general amateur that can effectively produce useful scientific data.
In this paper the testing of the QHY268 Mono is conducted in four parts:
- measuring the camera basic performance in terms of conversion factor (full well capacity), readout noise, dynamic range and dark current
- measuring the linearity of the camera
- testing the camera for recording spectra of variable stars and planetary nebulae
- testing the camera for demanding photometry such as observing exoplanet transits
For the first two goals the camera has been evaluated on a test bench taking various calibration frames. For the other goals images of real stars are taken and measured.
1. Measuring the QHY268 Mono – basic performance
Before illustrating results of the behaviuor of the camera we would like to highlight just a couple of things. The QHY268 Mono has a really beautiful fit and finish and to avoid condensation problems it has a small hole near the top of the camera that is covered by a black cap. In case of condensation on the front glass window QHY recommends to use a supplied tube of silica. The first test we have conducted was in a humid environment. However, keeping the cooler at -10C for the entire test duration resulted in no dew at all. Point to note is that in binning 1×1 the files are 50 Mb in size and even if the camera is equipped with an Usb 3.0 port it takes about 3 seconds to download images. On the other hand a CCD with similar size would take no less than 30 seconds to download a 1×1 binned frame.
The camera offers 4 operating modes, each of which delivers a different response curve in terms of readout noise and gain. After studying the curves provided by QHY we have tested mode #1 (high gain) and mode #3 (extend fullwell 2CMS) as we see no particular advantage of using the other two modes. For science observations, you want as little noise as possible but also a good dynamic range as in many star fields it is not possible to find comparison stars that have roughly the same brightness of the variable star we want to measure. For spectroscopy readout noise should be kept as low as possible because it is going to be more important than sky noise in terms of limitations, given that for best results this kind of observations are confined to relatively bright stars and exposures rarely saturate the sky.
Looking at the curves of mode #1 we can see that the best dynamic range is reached at gain 0 and 60. According to Richard Berry’s book Aip4win to make the evaluation it is necessary to take and measure 2 flats, 2 bias and 1 long dark (we have chosen 600 seconds). We then have measured the parameters of the camera at gain 0 and at gain 52- 56-58-60 and 64. Temperature has been set at -10C and to avoid pixels with zero value the offset has been set at 20. Offset is basically adding a pedestal to the image and we have found that a value of 20 results in pixels with a minumum value of around 150 – 200
ADU across the frame with an average of about 326 ADU. One thing to notice is that there is no amp glow at all. The 600 second dark frame show some hot pixels. However only 86 pixels appear to be saturated. Altough the number of saturated hot pixels is small, to avoid calibration problems you may want to reduce exposures to perhaps 300 seconds and stack multiple images.
 A highly stretched dark frame of 600 seconds taken through the QHY268 Mono showing no amp glow. The gain has been set at 64, offset 20 and temperature -10C
From the above-mentioned test we get the following results:
Mode #1 (high gain)
| Gain 0 | results | Notes |
| Conversion factor | 0.77 e/ADU | |
| Full well | 50,462 | |
| Readout noise | 3.56 e RMS | |
| Mean dark current | 0.001558 e/px/sec at -10C | |
| Dynamic range | 14,175 grey tones | Highest dynamic range |
| Gain 52 | ||
| Conversion factor | 0.39 e/ADU | |
| Full well | 25,559 | |
| Readout noise | 3.58 e RMS | |
| Mean dark current | 0.001744 e/px/sec at -10C | |
| Dynamic range | 7,139 grey tones | |
| Gain 56 | ||
| Conversion factor | 0.33 e/ADU | |
| Full well | 21,626 |
| Readout noise | 1.66 e RMS | |
| Mean dark current | 0.001641 e/px/sec at -10C | |
| Dynamic range | 13,027 grey tones | |
| Gain 58 | ||
| Conversion factor | 0.32 e/ADU | |
| Full well | 20,971 | |
| Readout noise | 1.59 e RMS | Lowest readout noise |
| Mean dark current | 0.001575 e/px/sec at -10C | |
| Dynamic range | 13,189 grey lines | |
| Gain 60 | ||
| Conversion factor | 0.31 e/ADU | |
| Full well | 20,316 | |
| Readout noise | 1.67 e RMS | |
| Mean dark current | 0.0016933 e/px/sec at -10C | |
| Dynamic range | 12,165 grey tones | |
| Gain 64 | ||
| Conversion factor | 0.28 e/ADU | |
| Full well | 18,350 | |
| Readout noise | 1.69 e RMS | |
| Mean dark current | 0.001594 e/px/sec at -10C | |
| Dynamic range | 10,858 grey tones |
From the above results we can then conclude that Gain 0 and Gain 58 are likely to deliver the best results for doing spectroscopy and photometry. Gain 0 will probably be more useful under light polluted skies while Gain 58 is probably more useful for fainter objects under semi-urban and dark rural skies.
By studying the curves of the other modes we have then tested mode #3 that offers a bigger full well and a reduced readout noise compared to mode #2. Here are the results for Gain 0 and Gain 40 (offset and temperature remain the same):
Mode #3
| Gain 0 | results | notes |
| Conversion factor | 1.28 e/ADU | |
| Full well | 83,886 | Highest full well |
| Readout noise | 5.82 e/Rms | |
| Mean dark current | 0.001429 e/px/sec at -10C | |
| Dynamic range | 14,413 grey tones | Highest grey tones |
| Gain 40 | ||
| Conversion factor | 0.82 e/ADU | |
| Full well | 53,739 | |
| Readout noise | 5.54 e/Rms | |
| Mean dark current | 0.001795 e/px/sec at -10C |
| Dynamic range | 9,700 gray tones |
From the above results we can then conclude that Gain 0 and Gain 58 are likely to deliver the best results for doing spectroscopy and photometry. Gain 0 will probably be more useful under light polluted skies while Gain 58 is probably more useful for fainter objects under semi-urban and dark rural skies.
By studying the curves of the other modes we have then tested mode #3 that offers a bigger full well and a reduced readout noise compared to mode #2. Here are the results for Gain 0 and Gain 40 (offset and temperature remain the same):
Mode #1 (high gain)
| Gain 0 | results | Notes |
| Conversion factor | 0.77 e/ADU | |
| Full well | 50,462 | |
| Readout noise | 3.49 e RMS | |
| Mean dark current | 0.002272 e/px/sec at -7.3C | |
| Dynamic range | 14,459 grey tones | Highest dynamic range |
| Gain 58 | ||
| Conversion factor | 0.32 e/ADU | |
| Full well | 20,971 | |
| Readout noise | 1.58 e RMS | |
| Mean dark current | 0.002595 e/px/sec at -7.2C | |
| Dynamic range | 13,272 grey lines | |
| Gain 59 | ||
| Conversion factor | 0.31 e/ADU | |
| Full well | 20,316 | |
| Readout noise | 1.54 e RMS | Lowest readout noise |
| Mean dark current | 0.002531 e/px/sec at -7.2C | |
| Dynamic range | 13,192 grey tones | |
| Gain 60 | ||
| Conversion factor | 0.31 e/ADU | |
| Full well | 20,315 | |
| Readout noise | 1.69 e RMS | |
| Mean dark current | 0.002571 e/px/sec at -7.3C | |
| Dynamic range | 12,021 grey tones |
We continue to test the behaviour of the QHY268 Mono in mode #1 at Gain 0 and Gain 58-59 since we feel that overall these are the best settings for this camera. We will however use mode #3 at gain 0 for exoplanet work when the parent star is bright.
.
2. Measuring the linearity of the QHY268 mono
We have conducted this test, according to Aip4win book by Richard Berry, by taking a series of increasing and decreasing flats to measure the deviation in Adu with different exposures. For each exposure time 2 flats and 1 corresponding dark has been taken. As baseline we have set an exposure of 0.5 sec to be slightly above the bias level and then we have used exposures up to 80 seconds to saturate the camera. The test has been conducted in mode #1, Gain 0 and Gain 58. Offset and temperature still at 20 and -10C respectively. Here are the results:
QHY268 Mono linearity test
Gain 0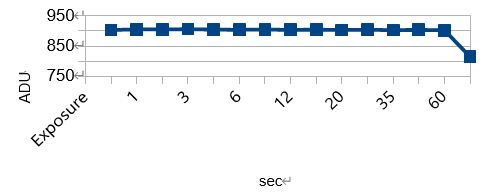
The above graph shows that the camera is very linear with a deviation of less than 0.3% from 500 ADU to 55,000 ADU. The 80 sec exposure is saturated so it cannot be taken into account for this test.
At Gain 58 results are basically the same:
QHY 268 Mono-linearity test
Gain 58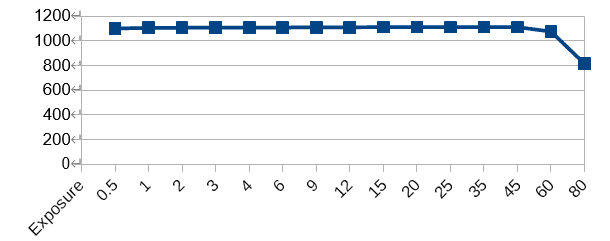
The exposures of 60 and 80 seconds are saturated so they cannot be taken into account for determining linearity.
Note that the graphs above are very sensitive as we have decided to plot the ADU per second instead of plotting the average ADU at each exopsure time so that even a minimal deviation can be clearly seen.
We conclude that the QHY268 is a very linear camera, much better than other CCDs we have tested in the past, many of which show an acceptable level of linearity only in a small ADU range. The linearity range of this camera is absolutely satisfactory to use it for science observations to near saturation limit. We think a deviation of about 1% is likely to take place over the almost entire range of this camera from 500 ADU to about 60,000 ADU. In the real world this is an extreme situation that may only take place when we have to measure the brightness of red giants in the near infrared where exposures are short to avoid saturation of the variable star and comparisons stars appear very dim.
Another thing that is worth noting is that this camera has very stable electronics (the average value of dark frames is the same at any exposure time, with minimal differences in standard deviation) so we expect less scatter in scientific data compared to other consumer cameras. This may be an advantage for examples when observing transiting exoplanets.
3. Testing the QHY268 mono for recording spectra of variable stars and planetary nebulae
Among the field of research, spectroscopy is becoming accessible for the amateur as nowdays a simple grating put in front of the camera, for example in a filter wheel, can deliver valuable data. The study of the spectra of variable stars is of utmost importance to understand the evolution of stars.
Here is a picture of variable star V Bootis, a semi-regular red pulsating giant that oscillates between mag. 7 and 12. The image has been taken through a simple 6” Newton, a star analyser 200 and the QHY 268 Mono. It is a stack of 12 exposures of 100 seconds and it has been dark corrected.
We can see that the strip of light, that it is actually the spectrum of this star, shows dark and bright bands. The dark bands are caused by the molecular band of Titanium Oxide that is typical of the atmosphere of class M giant stars. Note the image has very little noise thanks to the low readout noise of the camera (mode #1, gain 58, offset 20 temperature – 10C).
The little noise can also be confirmed from the spectrum profile of this star that shows very little scatter and a regular profile line.
We can also see that the star emits the majority of energy in red and infrared (intensity increases towards high wavelengths). The blue lines indicate the positionts of the molecular bands of Titanium Oxide. Monitoring the changing of the spectrum of this star during time give us a hint of the behaviour of this class of pulsating stars.
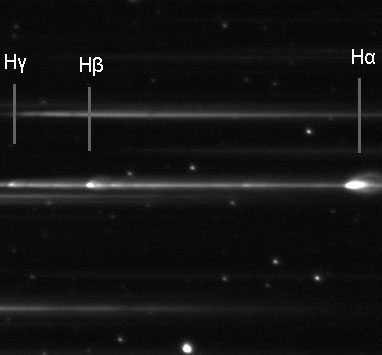
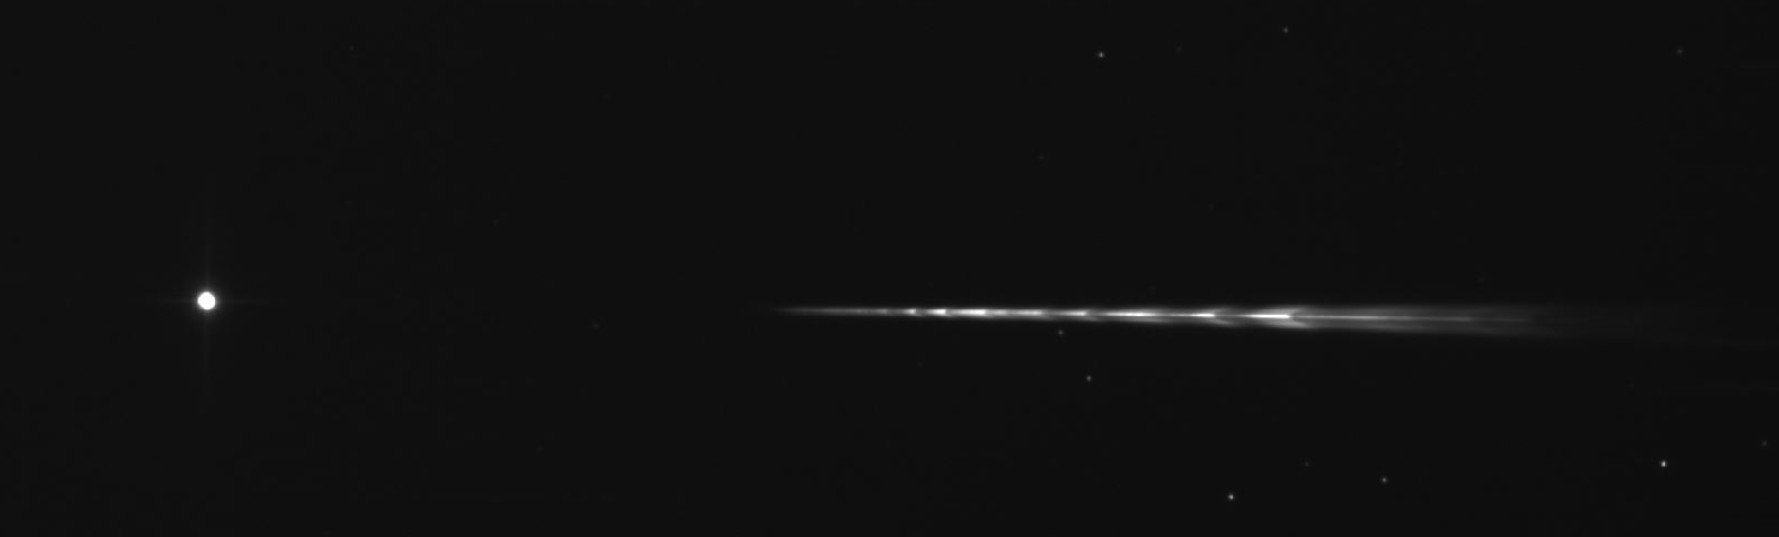
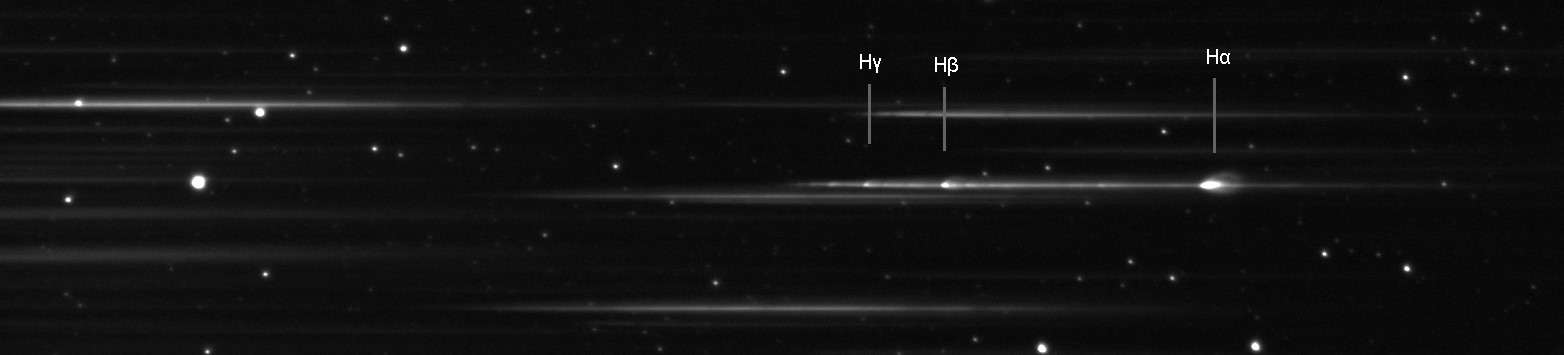
We have the decided to push a bit the camera by using a smaller telescope (Apo 80mm f/6 refractor) and setting the sensor temperature at -1C. The following is a stack of 20 images of 2 second exposure each, taken in mode #1, gain 59 and offset 20, of variable star Gamma Cassiopeiae, a Be star, that ejects gas into the stellar medium as it looses matter under a sort of stellar wind. The spectrum clearly shows the H-alpha emission line that appears as a bright dot towards the right end of the strip of light.
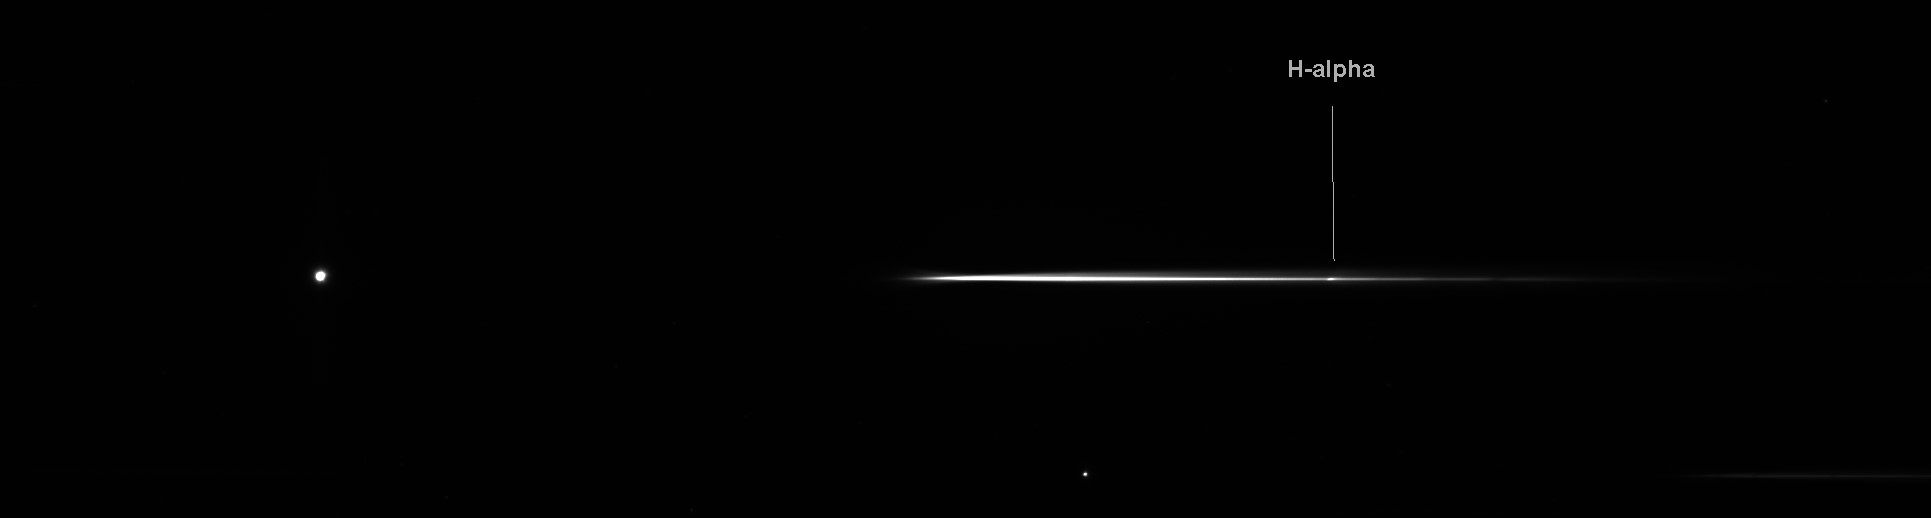
The emission line can be clearly seen and measured by plotting the spectrum in a specific software. The blue lines in the graph shows the positions of the Hydrogen Balmer lines. You can see the H-alpha, H-beta and H-gamma lines are all in emission (peaks over the red line of the spectrum).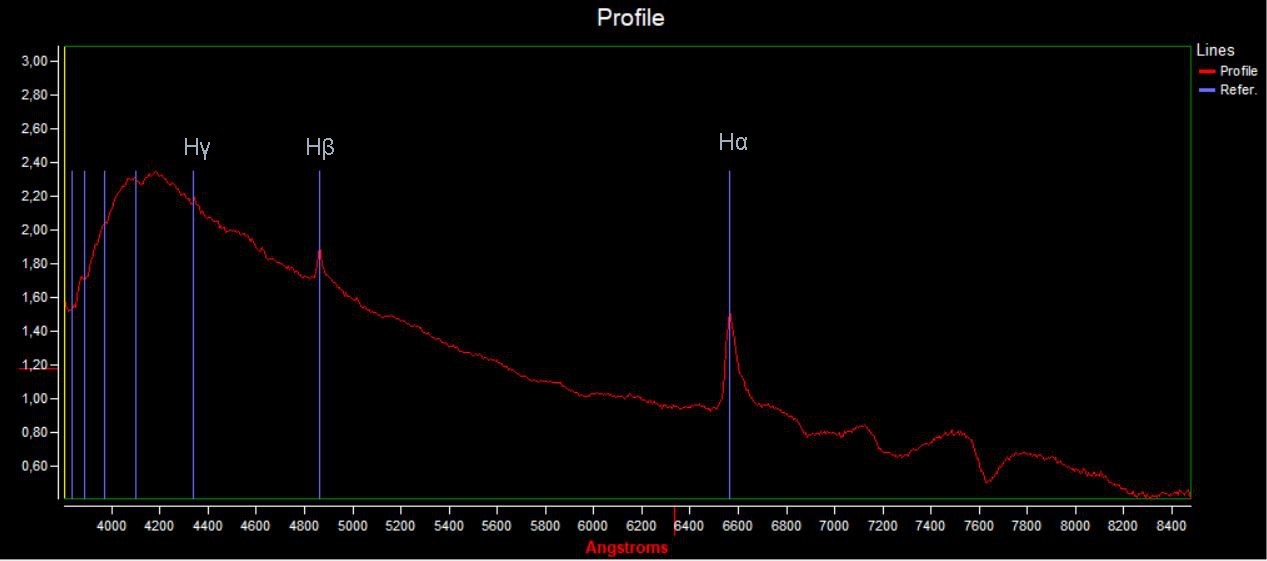
It can be noticed that even under less favourable conditions the spectrum has a quite regular profile indicating little scatter. Measuring the intensity and shape of emission lines enables us to understand the evolution of the variability of this star that in the past reached about mag. 1.5.
The following image is a stack of 10 images of 240 seconds each of the spectrum of Nova Cassiopeiae 2021 (V1405 Cas) a slow nova that reached about mag. 5.5 and that at the time of this image was at around mag. 8. We still use an 80 f/6 Apo refractor here and the QHY268 Mono at Gain 59 offset 20 and sensor temperature -1C.
The spectrum shows a series of bright dots showing emission lines including a very bright H-alpha emission line. Plotting the spectrum we can clearly see all the emission lines.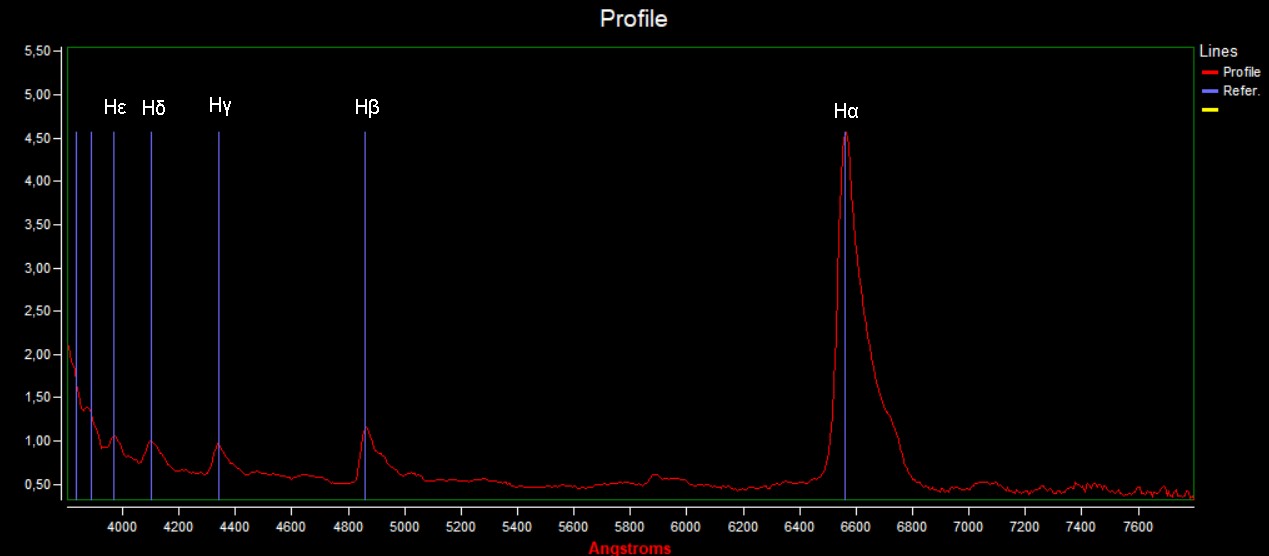
Again, the spectrum shows very little scatter indicating little noise regardless the images were taken under urban sky. Taking good spectra of novae is among the most useful work an amateur can do as it enables us to refine the physical models of this peculiar stars.
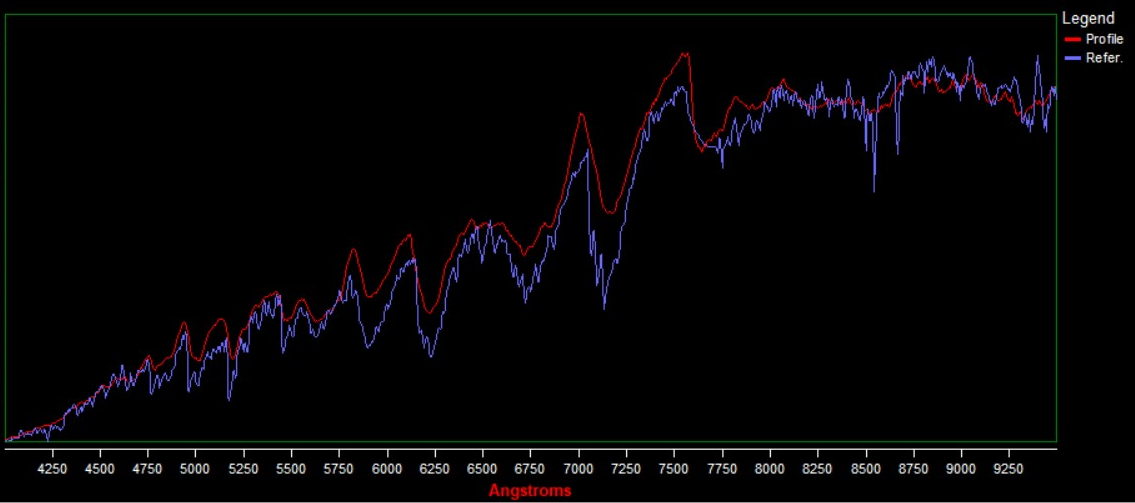
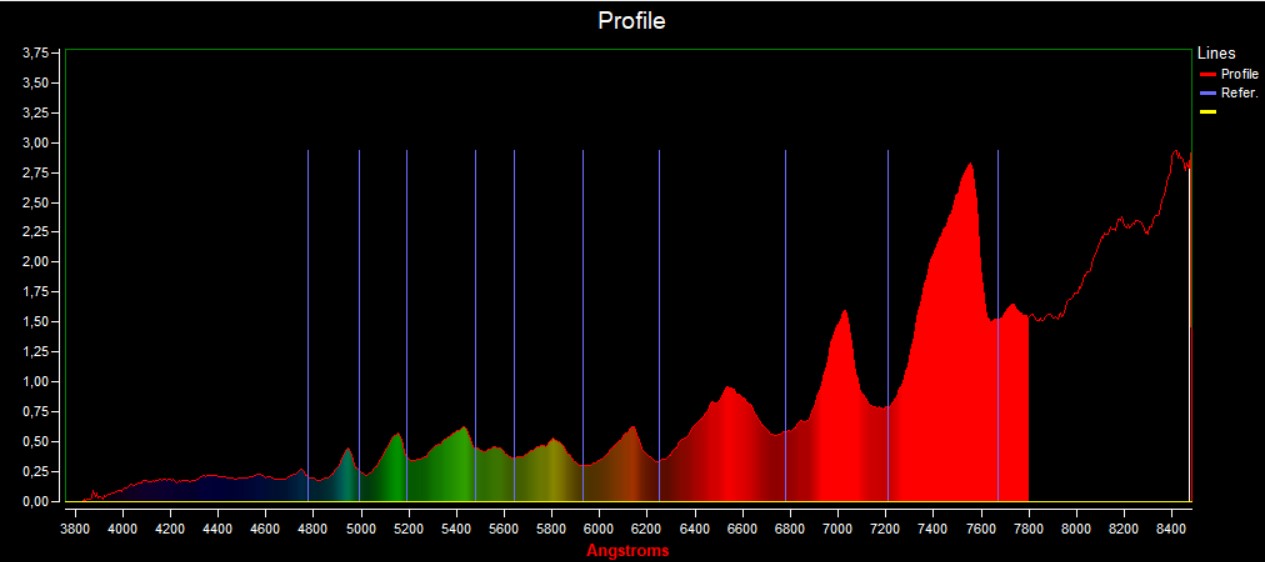
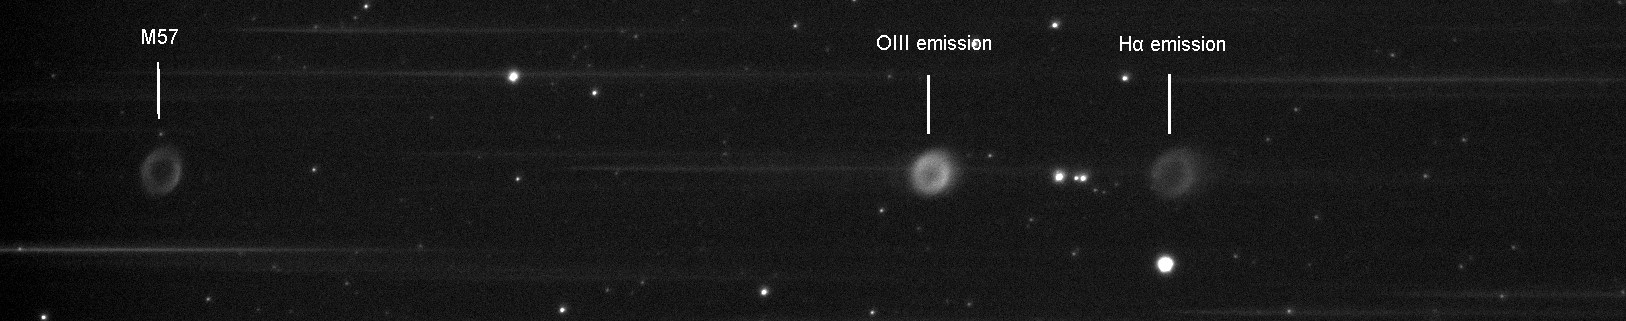
The following image is the spectrum of the famous ring nebula M57, an emission planetary nebula in the constellation of Lyra. In this case we can see different images of the nebula rather than a strip of light with emission lines. The two images towards the right hand side of the frame are actually the emission lines of OIII and H-alpha showing the main composition of the gas envelope.
Spectrum of the ring nebula taken through an Apo 80 mm f/6 refractor and the QHY268 mono. Stack of 3 exposures 240 seconds each. Camera settings: Mode #1, Gain 59, offset 20 and sensor temperature -1C.
Plotting the spectrum in the software shows the OIII and HA emission lines of the nebula at the corresponding Angstrom.
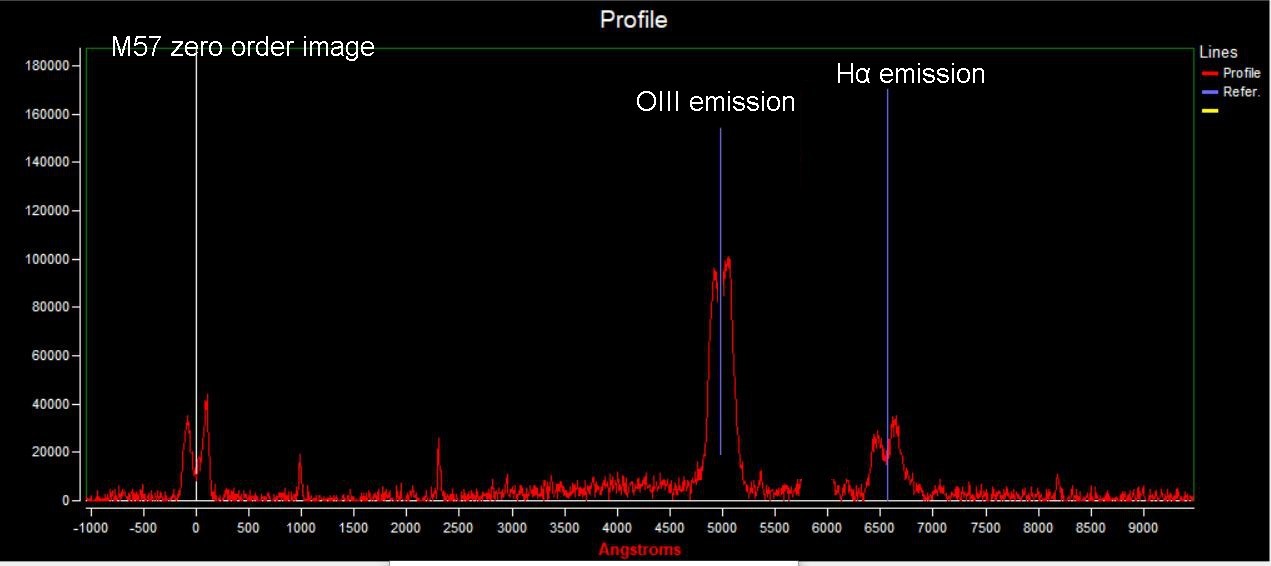
We can conclude that even under polluted skies, with a small telescope and with the sensor relatively warm (-1C), valuable results in the field of spectroscopy can be effectively produced with the QHY268 mono.
4. Testing the QHY268 mono for demanding photometry – exoplanet transits
We have then tested the camera to take photometric measures of an exoplanet transit. Transiting exoplanets are very demanding as they just obstruct a very tiny fraction of the incoming light of the star when they pass in front of it. For this type of observation we have chosen mode #3 at Gain 0 as it is necessary to get a good dynamic range and to use sufficiently long exopsures to reduce the effects of scintillation and to get the highest possible Signal to Noise ratio without saturating the star.
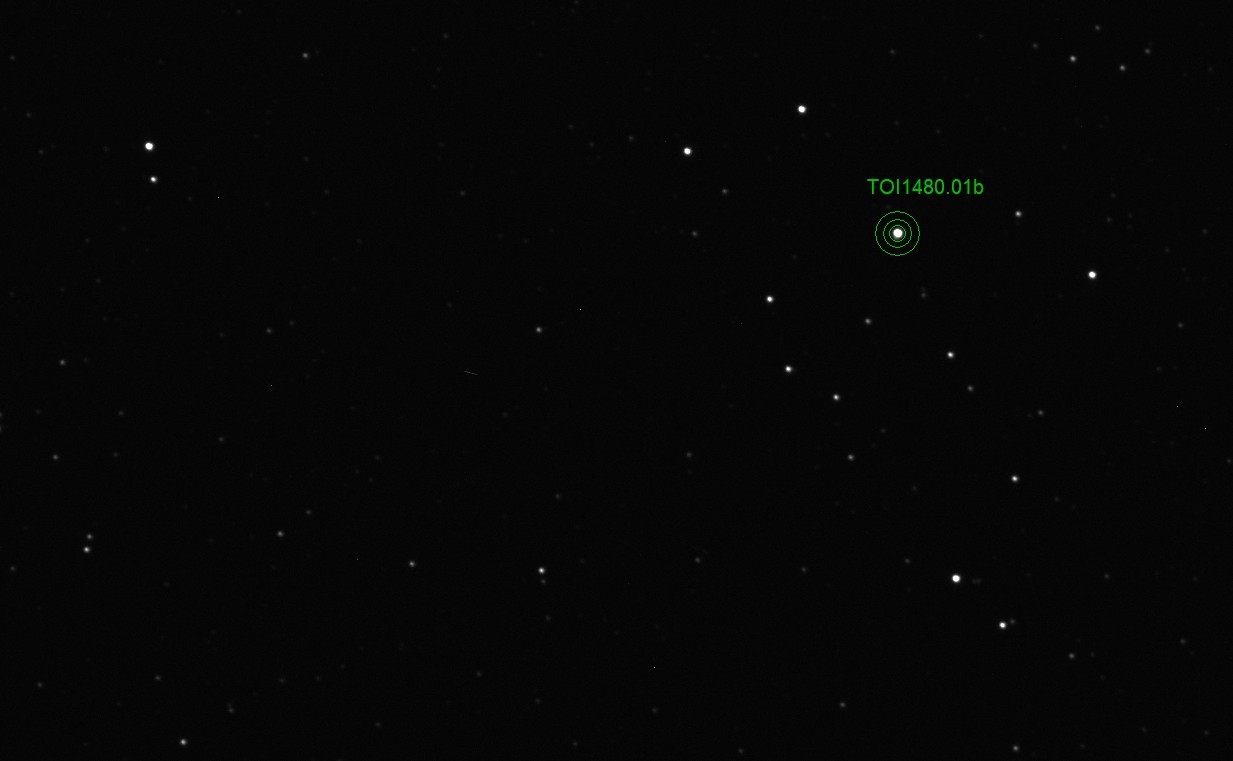
The following image is the star field of the candidate exoplanet TOI 1480.01.b in Cepheus. Observations from the TESS satellite indicate that the parent star (mag. 9.2) shows a very dim occultation (0.0109 mag) that may be caused by an exoplanet. Obervations of this star are important to potentially confirm the presence of an exoplanet. The telescope used is a Newtonian 6” reflector at f/4.6. We have used a red filter to reduce the effects of seeing and 50 second exposures.
We have then plotted the instrumental magnitudes measured after using 6 comparison stars of similar brightness of the parent star to get the light curve.
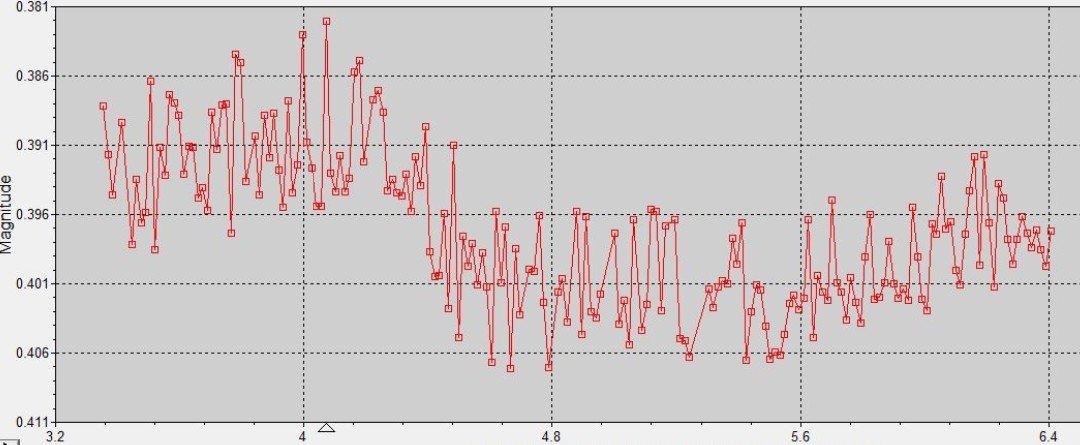
We can clearly see the decrease in brightness of the parent star at the predicted time regardless the decrease in brightness is very little. Notice that on the Y axis the plotted intervals in brightness are only 5 millimag.
Conclusions
The QHY268 Mono passed all our tests and can be considered to us as a suitable camera for doing science observations. Very little noise, very good linearity, stable electronics and the possibility of using different operating modes (we have found modes #1 and #3 as the most promising for our purposes) are the key features of this new camera. It is an ideal chioce for the amateur that wants to produce something more than just taking pretty images if the night sky. Additional tests will be carried out over the next months particularly for photometry using Sloan filters and to study the behaviour of red giants in r’ and i’ passbands. Please check the following URL for updates: https://alto- observatory.smugmug.com