

After the launch of the QHY600 refrigerated CMOS with native 16-bit AD conversion, the QHY600 has received wide attention from astrophotography lovers. And the first batch of production products was ordered out of stock in no time.
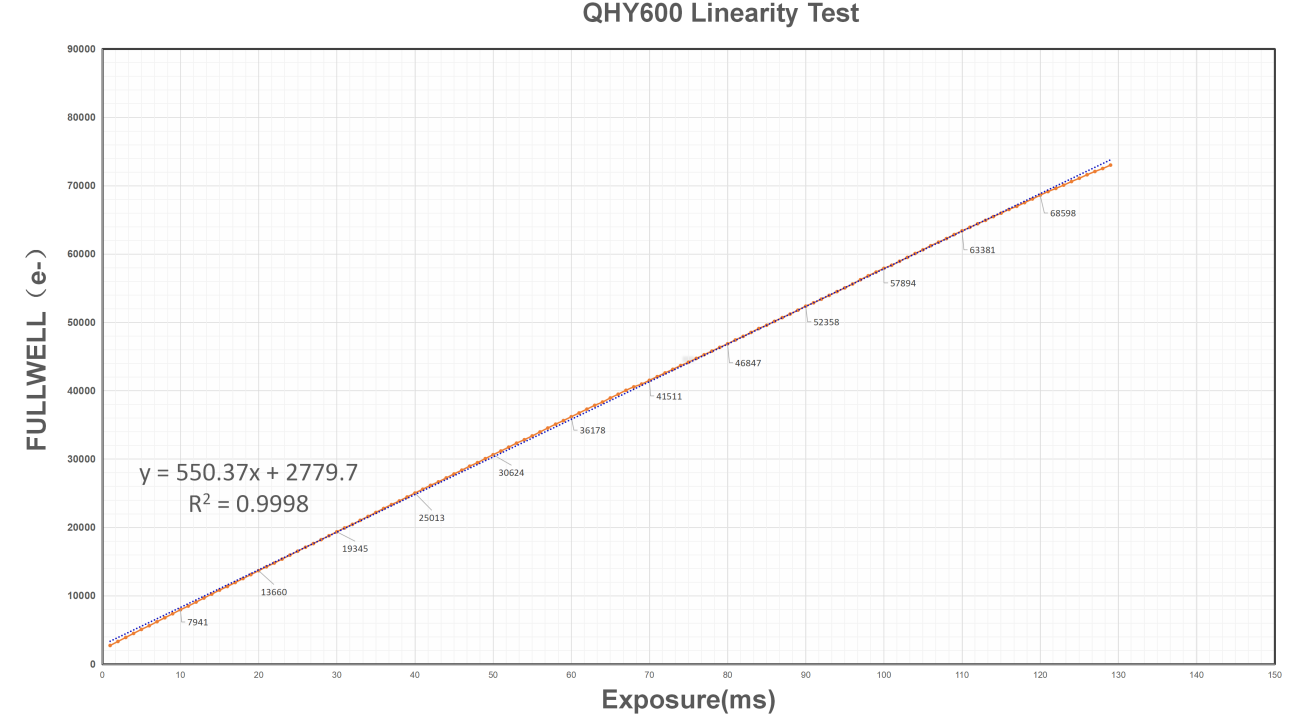
In order to obtain the maximum full well range data. We used a minimum gain of 2 in the QHY600 read mode (GAIN = 0). The obtained curve is as follows. Can be seen from the figure. QHY600 has very good linearity over a wide range. When the full well is greater than 73000e, the linearity starts to decrease. And the curve conforms to the law that the linearity of general image sensors starts to decrease in the near saturation region.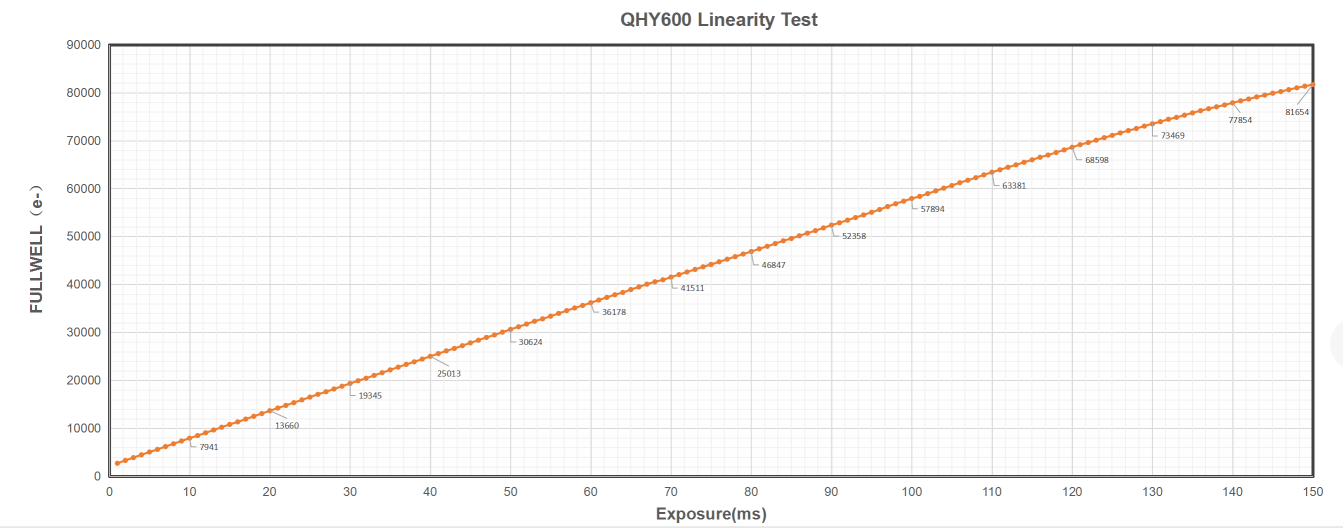 The linear fitting of the passed curve can make a more detailed assessment of the linearity situation. In order to avoid the influence of the non-linear region on the fitting result, we intercepted the part smaller than 73000e and fitted it.